April 3, 2024 6-8-statistics-and-probability, other-seasonal
Math Earth Day Activities for Middle School Students
By: Jeff Todd
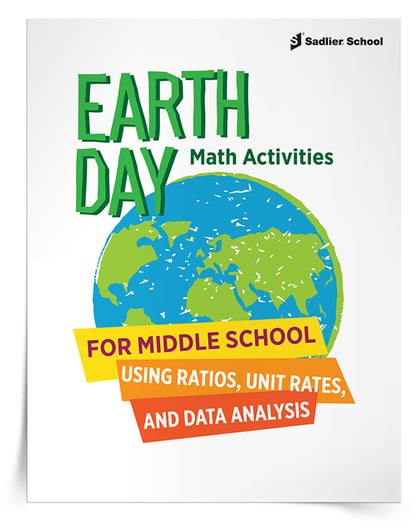
Earth Day is a great way to interest middle school students in how math can be used to understand the world around us. Today’s topic is how you can use ratios, unit rates, and data distributions for students to compare different countries’ carbon dioxide (CO2) emissions. With my printable Earth Day Math Activities, middle school students can engage in data analysis and conversations that inspire higher-order thinking about the environment!
Data Analysis Earth Day Activities for Middle School Students
I originally came up with this Earth Day idea when I came across a data set from the World Bank. In fact, the World Bank has a lot of data available that math teachers can download for projects.
Today's particular data set* includes the annual amount of CO2 emitted (in pounds) for each country, the population of each country, and its per capita income in U.S. dollars. The data set contains 106 countries, 23 world regions, and the world total for the year 2011 from the World Bank.
The Objective
Using this data set from the World Bank (available below), students will address the following key questions
-
Do poorer nations emit more or less carbon dioxide per person?
-
Which countries are exceptions? Why?
While I am sharing activity suggestions related to ratios, unit rates, and statistics, students will also have the opportunity to
-
read numbers great than one million
-
decide when and how to round numbers
-
use technology to perform their calculations
-
investigate data outliers
-
grapple with scientific notation on calculators or computers
Before Students Begin
First, model, either in a virtual class or video recording, how to create a ratio using the data before assigning countries to students. If you use region data for modeling, students can then use country data for their own calculations. The numerator is the number of kilotons of carbon dioxide produced in 2011. The denominator is the population in millions. For the whole world, here is the ratio and unit rate

This can be a benchmark that students can use to compare their countries. You can also give students work as a class to use the data points from different regions to compare different regions to the world average. The 2011 per capita income for each region and country as part of the Earth Day activities is also provided so that students can discuss how income may be related to CO2 emissions.
Next, assign countries to students. If you have 26 or fewer students per class, each student can be assigned four countries to complete the Earth Day math activities. If your class is has more than 26 students, then assign three countries to each student.
Earth Day Math Activities by Grade Level
Use the download data set to discuss topics in statistics.
In sixth grade, students can create a line plot to spark discussion about the measures of the center and the variability. (The average quantity of CO2 produced is 10.9 pounds per person, the median is 10 pounds per person, but the mode is one pound per person,) The data range from 0 to 97, but there is a larger cluster at the low end of the distribution. The distribution is skewed to the right.
In seventh grade, students can use line plots to compare the distribution of CO2 among rich and poor countries. They can also draw informal inferences from the data about how a country’s wealth affects its CO2 emissions. While students can create line plots on their own, note that the plots are also available below.
Many interesting questions can be asked about why certain countries are outliers giving students a greater insight into global issues.
The final product of the activities can be a one- or two-paragraph description of what students learned about the countries they researched and how these countries compare to world and regional averages. They can explain whether their countries are typical or outliers, and why. (Many of the outliers are oil- or natural gas-producing countries. I was surprised to find Trinidad and Tobago among these countries!)
Bonus Idea
In conjunction with your school’s Language Arts teacher, you could have students focus on any of several standards for writing informative/explanatory texts related to the Earth Day math activities, such as
-
introducing the topic
-
organizing the ideas, concepts and information
-
incorporating tables
-
using relevant facts
-
using math vocabulary
-
using formal style
-
providing a conclusion
In Summary
When you are considering activities for Earth Day, you will find the data and line plots that are included in the download useful for sparking discussion among your students about how different countries contribute to CO2 production. The downloads available are
-
student data, without pounds of CO2 per person
-
teacher data, with pounds of CO2 per person calculated
-
a line plot of the complete distribution
-
a line plot the comparing the upper 50% of countries to the lower 50%, based on per capita income
*Data set from The World Bank: World Development Indicators Database
Original Sources Include: (1) United Nations Population Division. World Population Prospects, (2) United Nations Statistical Division. Population and Vital Statistics Report (various years), (3) Census reports and other statistical publications from national statistical offices, (4) Eurostat: Demographic Statistics, (5) Secretariat of the Pacific Community: Statistics and Demography Programme, (6) U.S. Census Bureau: International Database (7) World Bank staff estimates based on sources and methods in World Bank's "The Changing Wealth of Nations: Measuring Sustainable Development in the New Millennium" (2011), and (8) Carbon Dioxide Information Analysis Center, Environmental Sciences Division, Oak Ridge National Laboratory, Tennessee, United States.


