July 23, 2018 3-5-measurement-and-data
Book-Inspired Graphing Activity Worksheets, Grades 2–4
By: Jeff Todd
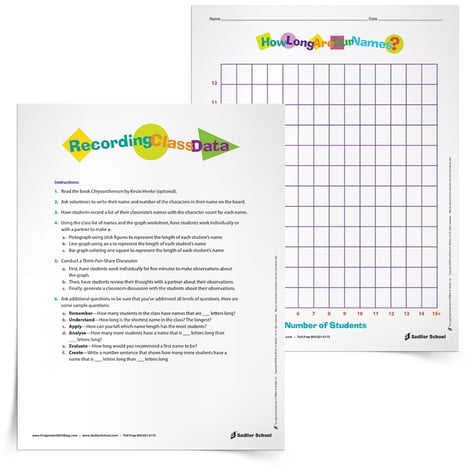
Here’s a fun graphing activity worksheet for second to fourth grade students. With this activity students will be graphing data about the character length of their first names and answering higher-order thinking type questions. This is a great icebreaker activity for the beginning of the year as it helps you and your students get to know each other’s names. Download the Recording Class Data Bar Graph Activity now.
Data Graphing Activity Inspired by Chrysanthemum by Kevin Henkes
The literacy tie in with math is the award winning book, Chrysanthemum, by Kevin Henkes. This popular picture book is the story of a mouse with a long unique name. When the mouse arrives at school and meets other students, with much shorter names, she becomes disenchanted with her own.
Start by reading aloud Chrysanthemum, by Kevin Henkes. Once you are done reading, ask three volunteers to share information about their name’s origin. Students love to hear about the history of names! Write each volunteer's name and character count on the board. Then model graphing data on the length of the three students’ names.

How to Use the Graphing Activity Worksheets
Now that students see the ease of graphing data of students' names, give each student a bar graph worksheet.
Have students record a list of all their classmate’s names with a count for the letters in each name. Students should create a tally chart and use the bar graph worksheet to record their data.
There are a number of ways students could use the bar graph worksheet for graphing data. Depending on the grade level students could create a:
-
Pictograph using a stick figure to represent the length of each student’s name.
-
Line Plot by using an x to represent the length of each student’s name.
-
Bar Graph by coloring the spaces to present the length of each student’s name.
After graphing data about the names, have students participate in a think-pair-share discussion about the graphs. I like to use Bloom’s revised taxonomy to create questions about the data. This ensures that I have questions at all different levels of thinking. Here are some examples of questions at different levels you could ask after completing the bar graph worksheet.
-
Remember—How many students in the class have names that are ___ letters long?
-
Understand—How long is the shortest name in the class? The longest?
-
Apply—How can you tell which name length has the most students?
-
Analyze—How many more students have a name that is ___ letters long than ___ letters long?
-
Evaluate—How long would you recommend a first name to be?
-
Create—Write a number sentence that shows how many more students have a name that is ___ letters longer than ___ letters.


