July 13, 2022 3-5-measurement-and-data
Choosing a Scale for a Bar Graph With Non-Unit Scales
By: Jeff Todd
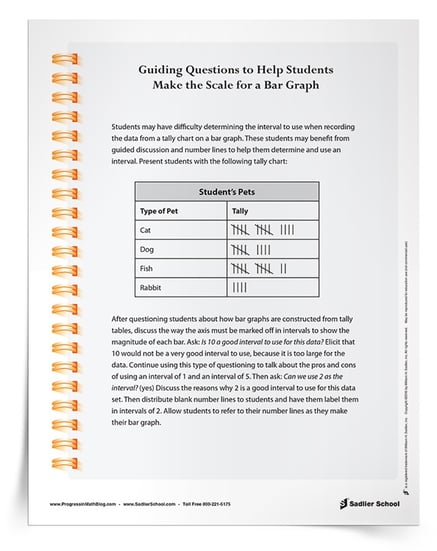
I wanted to share with you today some ideas about choosing the scale for a bar graph for Grade 3 and Grade 4. The download for this post is a tip sheet from the Progress in Mathematics math series that teachers can use to help guide students as they learn to create a non-unit scale on a bar graph starting with a tally table. If you are using the Progress in Mathematics series, this activity would be useful in Grade 3, Chapter 7 with lessons 2 and 3, and for Grade 4, Chapter 7 with lessons 1 to 3.

Ideas for Choosing the Scale for a Bar Graph
In the earlier grades, students create picture graphs and bar graphs that have single unit scales. Students generate data by sorting items. To help students interpret data, target questions at the early elementary level should focus on the total number of items, and the number of items, and compare whether there are more or fewer in each category. Students in Grade 2 use graphs to solve problems involving addition and subtraction such as how many more items are in one category than another. The number of items in each category is less than ten, and the bar graph scale counts by one.
In Grade 3, a stepping-stone to creating non-unit scales is for students to create picture graphs in which one picture represents more than one object. Students will need to create a key to show the value of each picture. Students will get the idea that they are counting by twos or fives using the pictures. This idea can be transferred to counting the bar graph scale and eventually to choosing a scale for a bar graph. This idea can be transferred to counting the bar graph scale. The analysis of bar graphs includes how many times more objects might be in one category than another and questions that require more than one operation to answer a question.
In Grade 3 and Grade 4, students build on their prior experiences with graphs with larger sets of data. The emphasis shifts from data generated by sorting objects to collecting data. With a larger number of items per category, students must start to make decisions about the scale on a bar graph. In the Progress in Mathematics series, in Grade 3, students can complete most exercises using a scale of 2. As they progress to Grade 4, students encounter even larger data sets requiring larger scales. If you are looking for an activity that will help students choose what the scale on a bar graph should be, then click on the download for the activity associated with this post.
If you are using the Progress in Mathematics series in Grade 3, then when you are working on Chapter 7 lessons 1 to 3, you can take a few minutes to skip ahead to Chapter 7 lesson 6 and just look at some of the graphs in the examples for line graphs that have scales by twos, fives, and tens. I think it would be helpful for students to see some examples before trying to choose their own scales. In Chapter 7 of the Grade 4 Progress in Mathematics book, there are already several examples of graphs with different scales in lessons 1 to 3.

Guiding Questions to Help Students Make the Scale for a Bar Graph Tip Sheet now. Use this resource to help students choose a scale for a bar graph with non-unit scales and determine the interval to use when recording data from a tally chart on a bar graph.


